Michael S. Pratte

Bayesian Modeling
Multivariate fMRI Analyses
Statistical Development
Visual Context Effects
Working Memory
Cognitive Control
Attention
Recognition Memory
Subliminal Perception
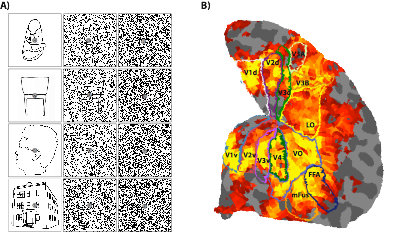
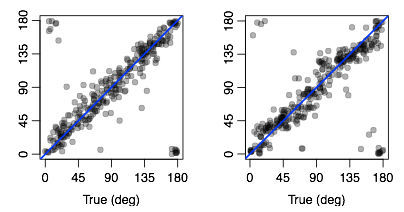
Standard univariate fMRI analyses determine whether individual voxels respond to some stimulus manipulation. Recently, multivariate approaches have been developed that allow a researcher ot determine whether an entire pattern of voxel activity, such as that in an early visual area, changes across some experimental manipulation. Doing so provides a more sensitive measure of whether some stimulus information is present in a brain area, allowing for more fine-grained question to be addressed with fMRI. I am currently developing novel multivariate approaches, with the aim of not just asking whether a brain area conveys information about an experimental condition, but instead understanding how this information is represented. Doing so allows for all kinds of questions to be addressed that are not currently possible. The figure above demonstrates some success with these approaches. Here we’ve trained a model on the relationship between the orientation of a grating being viewed, and the resulting activity patterns in early visual cortex. I then use this model to predict the orientation a person is seeing in a completely new trial, based solely on the activity pattern - Each point is the prediction for a trial plotted as a function of the true orientation, and their proximity to the diagonal shows that the model can accurately predict what orientation you’re looking at, based on the activity of voxels in V1. We can exploit this ability to further our understanding of orientation processing in the human visual cortex (see my work on the tilt repulsion effect), but I believe the approach will have wide-reaching applications.
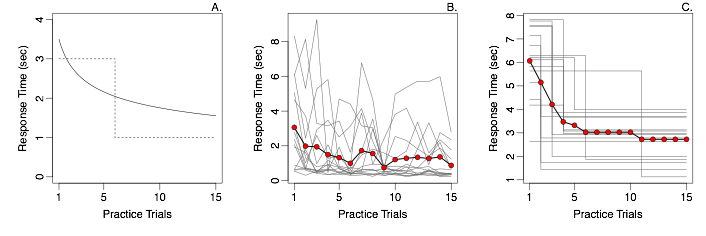
Some of the most important advances in cognitive psychology have resulted from the development and application of formal statistical models, such as signal detection, stochastic accumulator models and the discrete capacity model of working memory to name a few. All of this work relies on fitting the models to experimental data. However, the standard practices for doing so can often lead to distorted conclusions. Seminal work by Estes (1956) provides a striking example: Panel A shows two hypothetical learning curves, whereby reaction times either decrease gradually over the course of practice (solid line), or all learning happens in an instant (dotted). Panel B shows observed learning curves from Reder and Ridder (1992). The individual data are just too noisy to learn anything, and so the data are often averaged over subjects (red dots). It is tempting to interpret this averaged data as evidence for gradual learning. However, Panel C shows a case where each participant exhibits all-or-non learning, and yet the averaged learning curve shows a gradual decrease in RT. The conclusions from the averaged data are not just a little wrong; they actually provide compelling evidence for the wrong model!
This is an example of the distortion that can happen when data are averaged over things that vary: The result may not at all reflect the underlying cognition. Unfortunately, avoiding averaging over subjects is not enough, as the same distortion happens if data are averaged over trials with different items (e.g., some stimuli are easier to learn than others), or any other source of nuisance variability. The only solution to this problem is to explicitly include these sources of variability into the model itself, for example, by allowing each participant and each item to have their own rate of learning. Doing so produces models that can have thousands of parameters, which are often embedded within complex non-linear structures. Such models cannot be estimated with standard maximum likelihood techniques. Fortunately, recent advances in hierarchical Bayesian model estimation have provided solutions that are highly suited for such problems, and my colleagues and I have used them successfully in many domains in order to parse out noise from participants and items, providing a clear view of the underlying cognition.
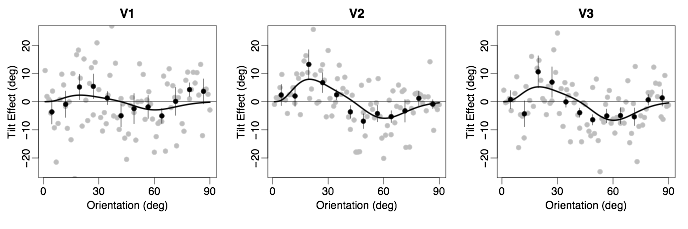
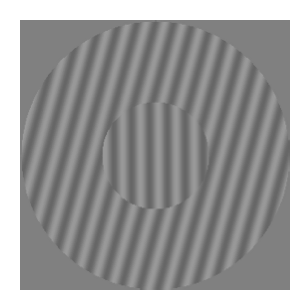
The central grating on the left is in fact orientated perfectly vertically, however the surrounding grating makes it appear to be tilted counterclockwise. Knowing why this illusion occurs would provide great insight into early visual processing, and while there are many good theories and models of its source, we still don’t really know what causes it. The multivariate fMRI techniques I have developed allow us to measure whether this illusion is present in the cortical representations in early visual areas, how it might differ across areas, and how these representations underly the behavioral phenomena. The key question is whether a visual area, such as V1, represents this central grating as being vertical or whether the activity pattern looks as if the grating is tilted clockwise by 10 degrees. In fact, we see evidence for tilt illusions throughout the early visual cortex, and the magnitudes of these illusions in extra striate areas may even be larger than the behavioral illusion.
Attending to a location, feature or object changes a lot about how we process incoming information. For example, attending to an object that’s embedded in noise, such as the chair or shoe in the figure, has been shown to increase our sensitivity to the object and decrease sensitivity to the noise. Determining how this happens with behavioral experiments is difficult: How can we measure a subject’s sensitivity to an object in unattended conditions, without drawing their attention to them? Instead, we used fMRI and multivariate methods to measure the amount of object-specific information in a visual area under various noise and attention conditions. Critically, this allowed us to assess how information is processed even when participants were completely ignoring the object information. Combined with formal models of how attention might influence signals and noise, we are able to better-understand the mechanisms by which attention acts to de-noise incoming visual information.
Working memory refers to our ability to retain information over short time periods. Working memory is typically characterized as a memory system that is extremely accurate at remembering only a small number of things. For example, only a few numbers, letters, colors or orientated gratings can be remembered at a time, but these few will be remembered very accurately. Understanding the nature of this limited storage capacity is fundamental to understanding how working memory functions, and much of my work aims to better understand these limitations. In addition, I use fMRI to understand how how the information that is stored is represented and maintained in the brain.
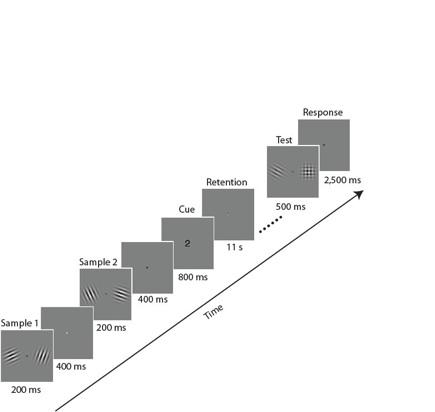
For example, we showed participants two pairs of orientated gratings and asked them to retain one of the pairs for the following 11-second retention interval (Pratte & Tong, in review). We used multivariate pattern classification analyses to determine which brain areas contained information about the orientation of each grating, and found that the information was represented in a spatially-specific manner, just as vision is. In particular, in early visual areas the grating on the left was represented mainly in the right visual cortex, and the grating on the right was in the left cortex. This and other endeavors are supporting the notion that working memory is intimately related to vision, and that the same neural mechanisms may underlie both processes.
Recognition memory has traditionally been characterized as a signal detection process -- If something elicits enough memory strength, then you’ll report that you recognize it, otherwise you will report that it’s something you didn’t previously encounter. More recently, or ability to recognize things has been characterized by a more complex dual-process model, whereby we either recognize things based on a sense of familiarity that is similar to the signal detection process, or by an explicit, all-or-non recollection process.
In order to really compare these and other models of recognition memory, it was first necessary to develop models that accounted for the many sources of variability in memory tasks. For example: People have different memory abilities, some items are easier to remember than others, and the more time that passes between the study and test of an item will affect performance. Failing to account for these things by averaging over them, as is necessary for typical model fitting approaches, can lead to very incorrect conclusions to be drawn from the data. To avoid this distortion, we have developed signal detection, dual-process, and other models that explicitly account for all this nuisance variability. These are big models, often with thousands of parameters, and I use advanced hierarchical Bayesian techniques to estimate them.
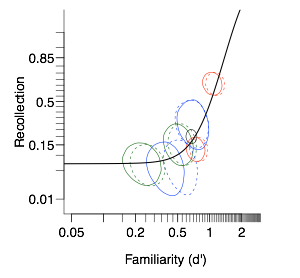
Armed with sound modeling techniques, I have conducted several experiments to try to get at the heart of the issue of how many processes are needed to explain recognition memory. For example, in the figure above I show the estimated recollection for each of several experimental conditions plotted as a function of the estimated familiarity for these conditions, derived by fitting the hierarchical Bayesian dual-process model. The fact that all of these points fall on a line suggests that in fact a single process underlies recognition memory. If instead there were two processes, we should not be able to predict the level of one based on the other.
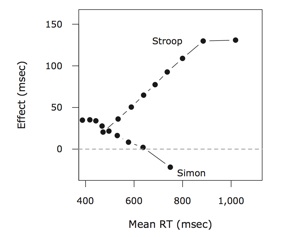
In the Stroop task, you are faster to identify the color of a word as red when the word says “red” than when it says “green”. In the Simon task, you are faster to identify that a square is colored red with a left-handed button press when the square is presented on the left side of the screen than when it’s on the right side. These two simple tasks are thought to tap into some sort of cognitive interference processes across color and word processing (Stroop) and color and space processing (Simon). Although the tasks are similar, the pattern of effects are remarkably different. This difference is most easily seen in the so called delta plots on the right. These lines show the size of the congruency effect as a function of time. Whereas the Stroop effect grows over time, the Simon effect gets smaller, and even reverses for the slowest responses. We really don’t know why these effects look so different, given the similarities of the tasks, but they certainly suggest fundamental differences in these sorts of interference. These important differences are masked when only mean reaction times are considered, and this work is an example of what more can be learned by performing distributional analyses on reaction time data.
RED RED
GREEN GREEN
There is a large body of literature dedicated to showing what things we can do in the absence of conscious awareness. Many such demonstrations involve surprisingly high-level processes. For example, it’s often suggested that primes can act in the absence of awareness. In one version of such tasks, a prime digit from 1-9 is presented briefly and masked, and followed by a target digit. When participants identify the target as being less-than or greater-than five, responses are faster if the prime is on the same side of 5 as the target. This number priming effect is said to occur even if participants fail to identify the status of the primes, thus, it’s called subliminal priming. The implication is that you can perceive, read, and encode the greater-than-five states of the prime, and that this status will influence later processing, all in the absence of conscious awareness.
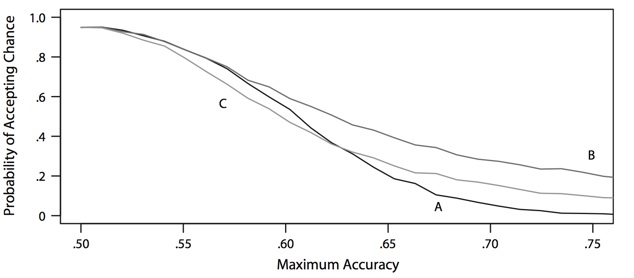
This logic behind these demonstrations relies critically on showing that subjects can not identify the primes as greater or less than five, as otherwise it would just be a priming effect. We have highlighted two critical challenges in doing so. The first is statistical: How does one garner evidence for the null hypothesis that people’s performance does not differ from chance? The plot above shows that the typical approach of using a t-test to accept the null comes with a huge probability of accidentally claiming people are at chance even when they are all above chance, often greater than 80%! To avoid this wildly inflated Type II error rate, we developed a Bayesian model that quantifies the evidence for and against the null hypothesis of chance performance. The second challenge is experimental: In this task you ask a person to identify a number that they may or may not see as being greater or less than five. We suspect that most of the time such stimuli are actually visible, but only barely so, making this task extremely frustrating for the participant. Consequently, participants, even the good ones, may quickly just stop trying, making it seem like they can’t perceive anything when really they just don’t enjoy trying to see something that they know is intended to be invisible. Such statistical and methodological challenges have led my colleagues and I to be skeptical of previous claims of subliminal priming effects, as our search for their existence using principled methods has repeatedly failed.
Substantive Applications