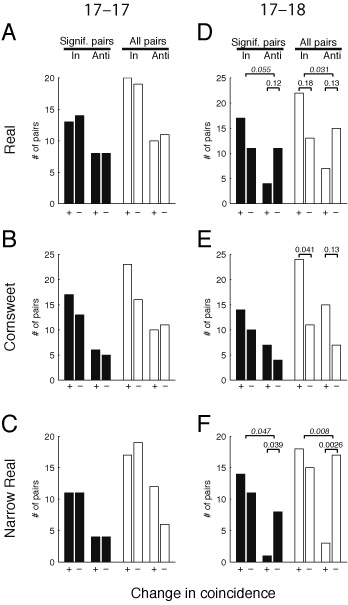
Changes in coincidence (±1 msec) do not match expected strengths of C and NR stimuli
Comparison of number of pairs showing increase (+) and decreases (–) in coincidence (area of peak within ±1 msec of zero). Layout is same as in Fig 3 bar plots, except here ‘Signif. Pairs’ refers to pairs showing significant changes in coincidence. Significance values for binary outcomes (+ or –, two-tailed binomial test) are listed above plots. Italicized numbers indicate significance of difference in proportion of increases versus decreases for ‘In-phase’ versus ‘Antiphase’ pairs (Fisher’s exact test). Significance testing based on the Kruskal Wallis test is provided in Supplemental Text. All significance values are based on two-tailed tests.
Differences between In-phase versus Antiphase 17–18 pairs were better matched to the perceived strengths of the stimuli for shifted peak height than for coincidence changes. Measurements of coincidence and peak height of shifted pairs yielded similar results under the Real condition. However, under the perceptually-matched Cornsweet condition, no difference between In-phase versus Antiphase coincidence was seen, whereas a significant difference was found for shifted peak height. Also, under the perceptually weaker Narrow Real condition, where we would expect weaker changes in shifted peak heights, we observed no significant difference in peak heights for In-phase versus Antiphase pairs. However, a significant difference was seen for changes in coincidence (largely due to changes in Antiphase pairs). Thus, the perceptual strengths of the stimuli are better matched by the shifted peak heights than by changes in coincidence.