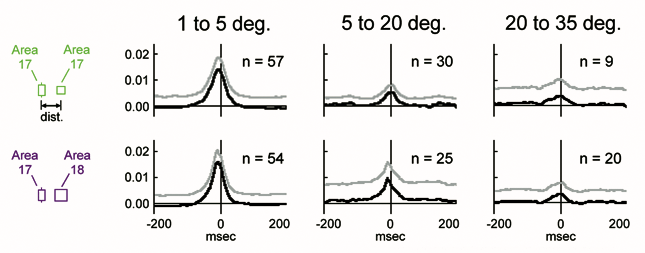
Average baseline correlograms are biased at short distances and height decreases with RF separation
17–17 (top row) and 17–18 (bottom row) baseline correlograms were grouped by receptive field separation distance (schematic of distance shown at left) and averaged from all pairs. Averaged correlograms (gray curves) and correlograms following shuffle-subtraction to remove baseline offset (black curves) are shown. At 1 to 5 deg receptive field separation, the bulk of the correlogram is left of zero, indicating a surface-to-border bias (surface detector fires before border detector). Peak height and position bias drops off with distance, more quickly for 17–17 pairs (dropoff within 5 deg) than for 17–18 pairs (dropoff within 20 deg). To more fairly compare 17–17 versus 17–18 pairs, our analysis is restricted to pairs with RF separations < 5 deg.