Cross-correlogram widths are comparable to those previously reported for cortical-cortical pairs
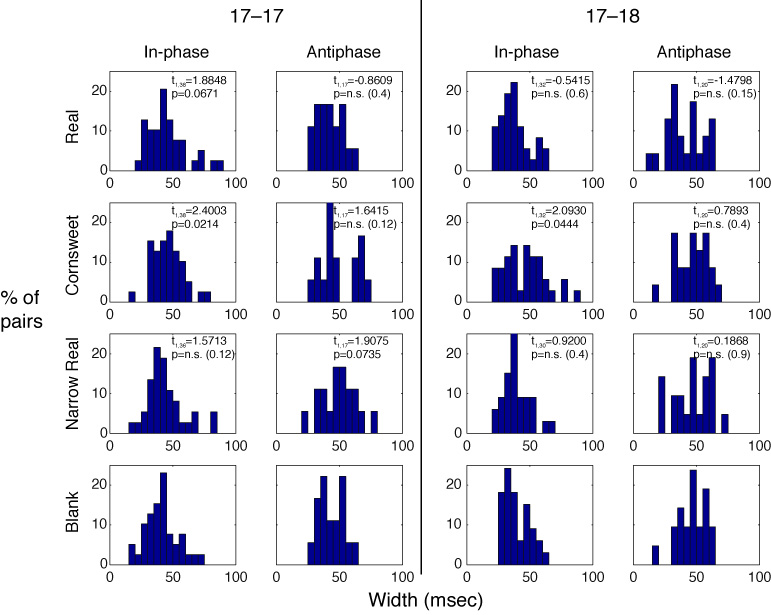
Peak strengths can be derived from peak widths as well as from peak height. Histograms below show the distributions of peak widths for 17-17 and 17-18 pairs, grouped by In-phase and Antiphase pairs. Bars are 5 msec wide. The distributions of widths, measured at half height, are comparable to previous reports of cortical-cortical pairs (Nowak et al. 1995, Roe and Ts'o 1999). Paired t-test results compare evoked (Real, Cornsweet, Narrow Real) conditions versus Blank. Significant increases in width are seen for both 17–17 and 17–18 In-phase pairs under the Cornsweet condition, consistent with results from peak height.