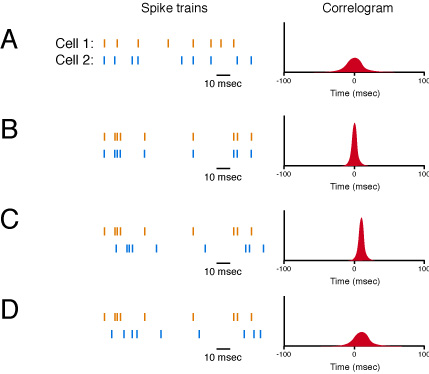
Examples of how different patterns of precise spike timing can affect the shape of cross-correlograms
Examples of how differences in relative spike times affect the shape of the CCH. Hypothetical rasters from pairs of cells are shown at left, and the corresponding CCH is shown at right. (A) Example of a cell pair with weakly correlated spike times, leading to a small peak centered at zero msec. (B) Example of a cell pair with perfectly coincident spike times, leading to a sharp CCH peak centered at zero msec. (C) Example of a cell pair where spikes from cell 1 precedes spike from cell 2 by 10 msec, leading to a corresponding positive 10 msec offset in the CCH peak position. (D) Example of a cell pair with spikes from cell 1 leading spikes from cell 2, but with a slight jitter in the spikes from cell 2. This leads to a broader and lower CCH.