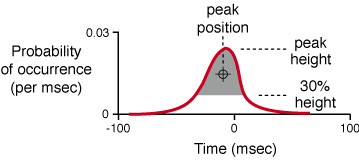
Measurement of peak center-of-mass position, peak height, and coincidence
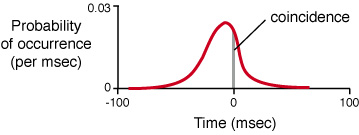
Cross-correlation histograms (CCHs, red curve) were generated based on the relative times of spikes recorded from pairs of cells. Relative spike times are indicated by the abscissa, where positive times indicate instances were a spike from the first cell precedes a spike from the second cell, and negative times indicate instances where a spike from the first cell follows a spike from the second cell. Ordinate indicates frequency of occurrence at each relative spike time. CCHs were corrected for average firing rate by normalization for spike count, which normalizes the area under the entire CCH to one. CCHs were then corrected for stimulus-related modulations in driven rate by shuffle-subtraction (see methods).
Peak height was measured as the height of the peak of the CCH. Peak position was based on the center-of-mass position (crosshair) of the area of the CCH 30% above the baseline (area shaded in gray). This definition of center-of-mass peak position was more reliable across bootstrap (cycle) randomization, compared to position based on the location of the peak.
In Fig S3, we quantified the changes in coincidence by measuring the area of the peak within +- 1 msec of zero time difference (gray area in CCH below).