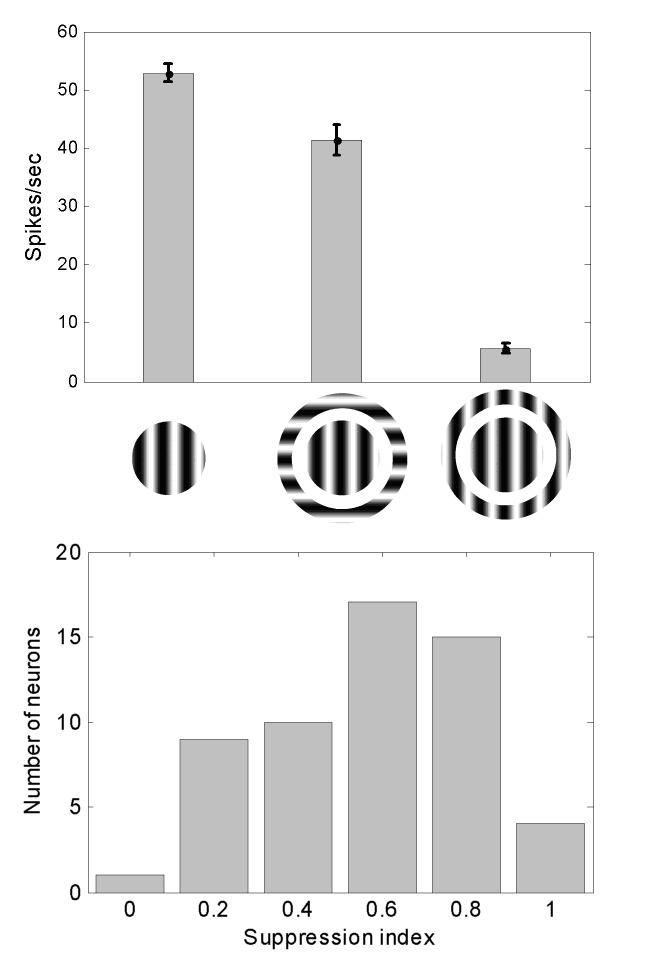
Fig 8. Top: The responses of a typical V1 neuron in the bush baby for a sinusoidal grating at the preferred orientation presented inside the sRF (left bar), for the center stimulus and an orthogonally oriented surround (middle bar), and for the center and iso-oriented surround (right bar). Error bars indicate 1 standard error of the mean. Bottom: The distribution of suppression indices is shown for 56 V1 neurons.