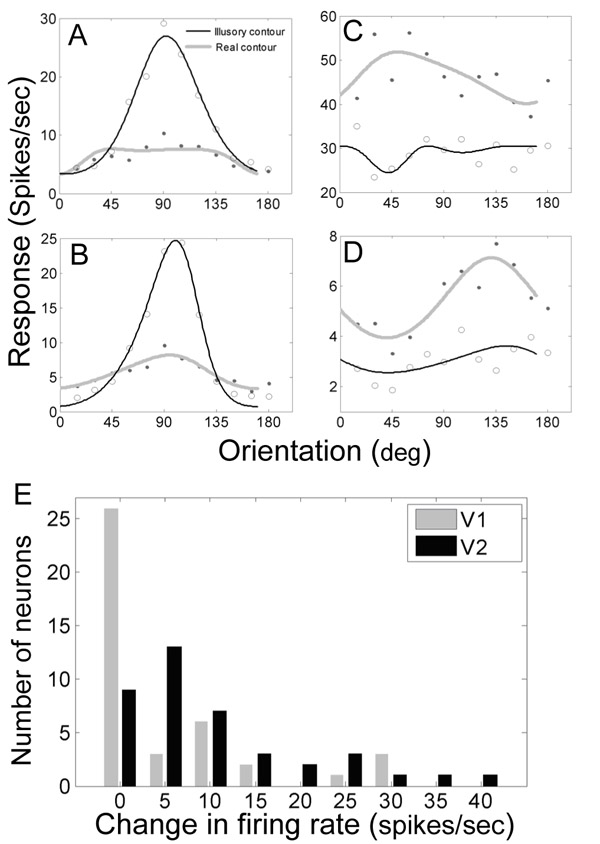
Fig. 4. A,B Responses of 2 V2 neurons to an abutting gratings-defined illusory line and a luminance-defined real line. C,D Responses of 2 V1 neurons to the same stimuli. The best fitting skewed von Mises circular distribution is shown as the tuning curve (210) . E. The distribution of increase in response above background value evoked by a single illusory line at the preferred orientation is shown for V1 and V2 neurons.