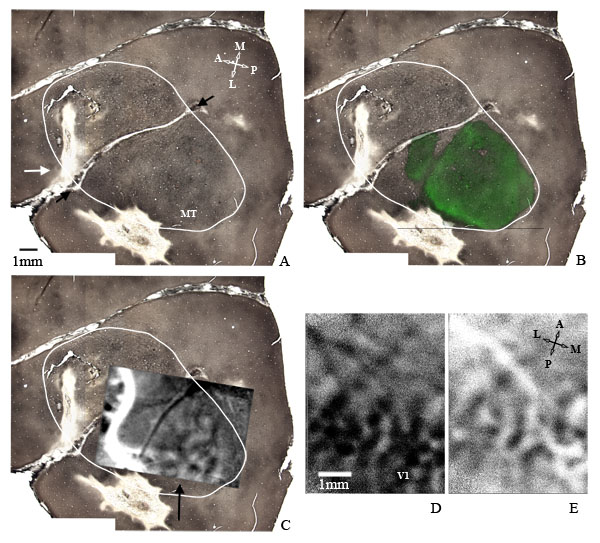
Fig 17. Example of MT blocking. A. The effect of blocking the central vision representation of area MT on the optically imaged activity in a retinotopically matched area of V1. A. Tangential cytochrome oxidase (CO) stained section through area MT showing the borders of MT outlined (white). The thick white line, marked by two black arrows, intersecting the outline is a blood vessel with origin at the superior temporal sulcus (STS), marked by black arrow. Scale for A-C is in lower left. Orientation for A-C is in upper right. B. Muscimol blocked zone is marked by fluorescent false colored green and overlaid on the histological section from A. C. Differential image of activity in response to horizontal and vertical stimuli on the histological section from A (marked with black arrow). The dark areas in the image correspond to zones of MT preferring horizontal bars and light areas to zones preferring vertical bars. D. and E. depict activation in the V1 before and after the MT block, respectively. The dark and light areas correspond to activity in response to horizontal and vertical moving gratings. The contrast in E. is less due to decreased activation after the block. The scale and orientation are given in lower left and upper right of D