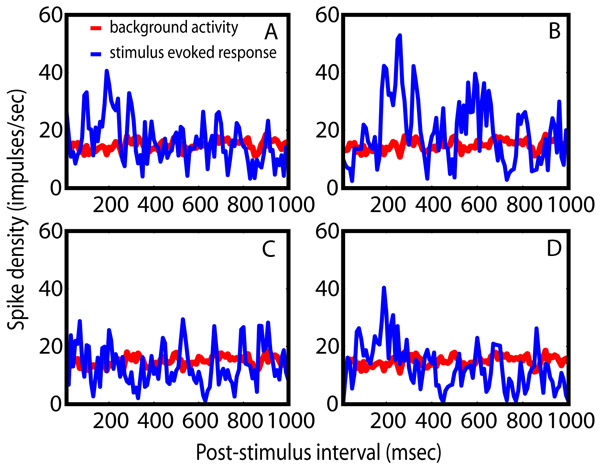
Fig 11. Post-stimulus spike density plots are shown for a pulvinar neuron for 4 different stimuli (see text for details). The red line is the background response and the blue lines are stimulus evoked responses.
|
Fig 11. Post-stimulus spike density plots are shown for a pulvinar neuron for 4 different stimuli (see text for details). The red line is the background response and the blue lines are stimulus evoked responses. |